9
Essential Analytics Reports Website Owners Must Use
If you have a website, then chances are you have the goal of
getting
more visitors to it. Whether you are the website owner or a marketer,
your job is to find out how, what, where, and why in order to fine-tune
your website marketing strategies. In this guide, we'll share with you
the nine website analytics reports you need to familiarize yourself
with to get the most out of your website analytics data.
1. Get an overview of your website traffic with the Visitors
Overview.
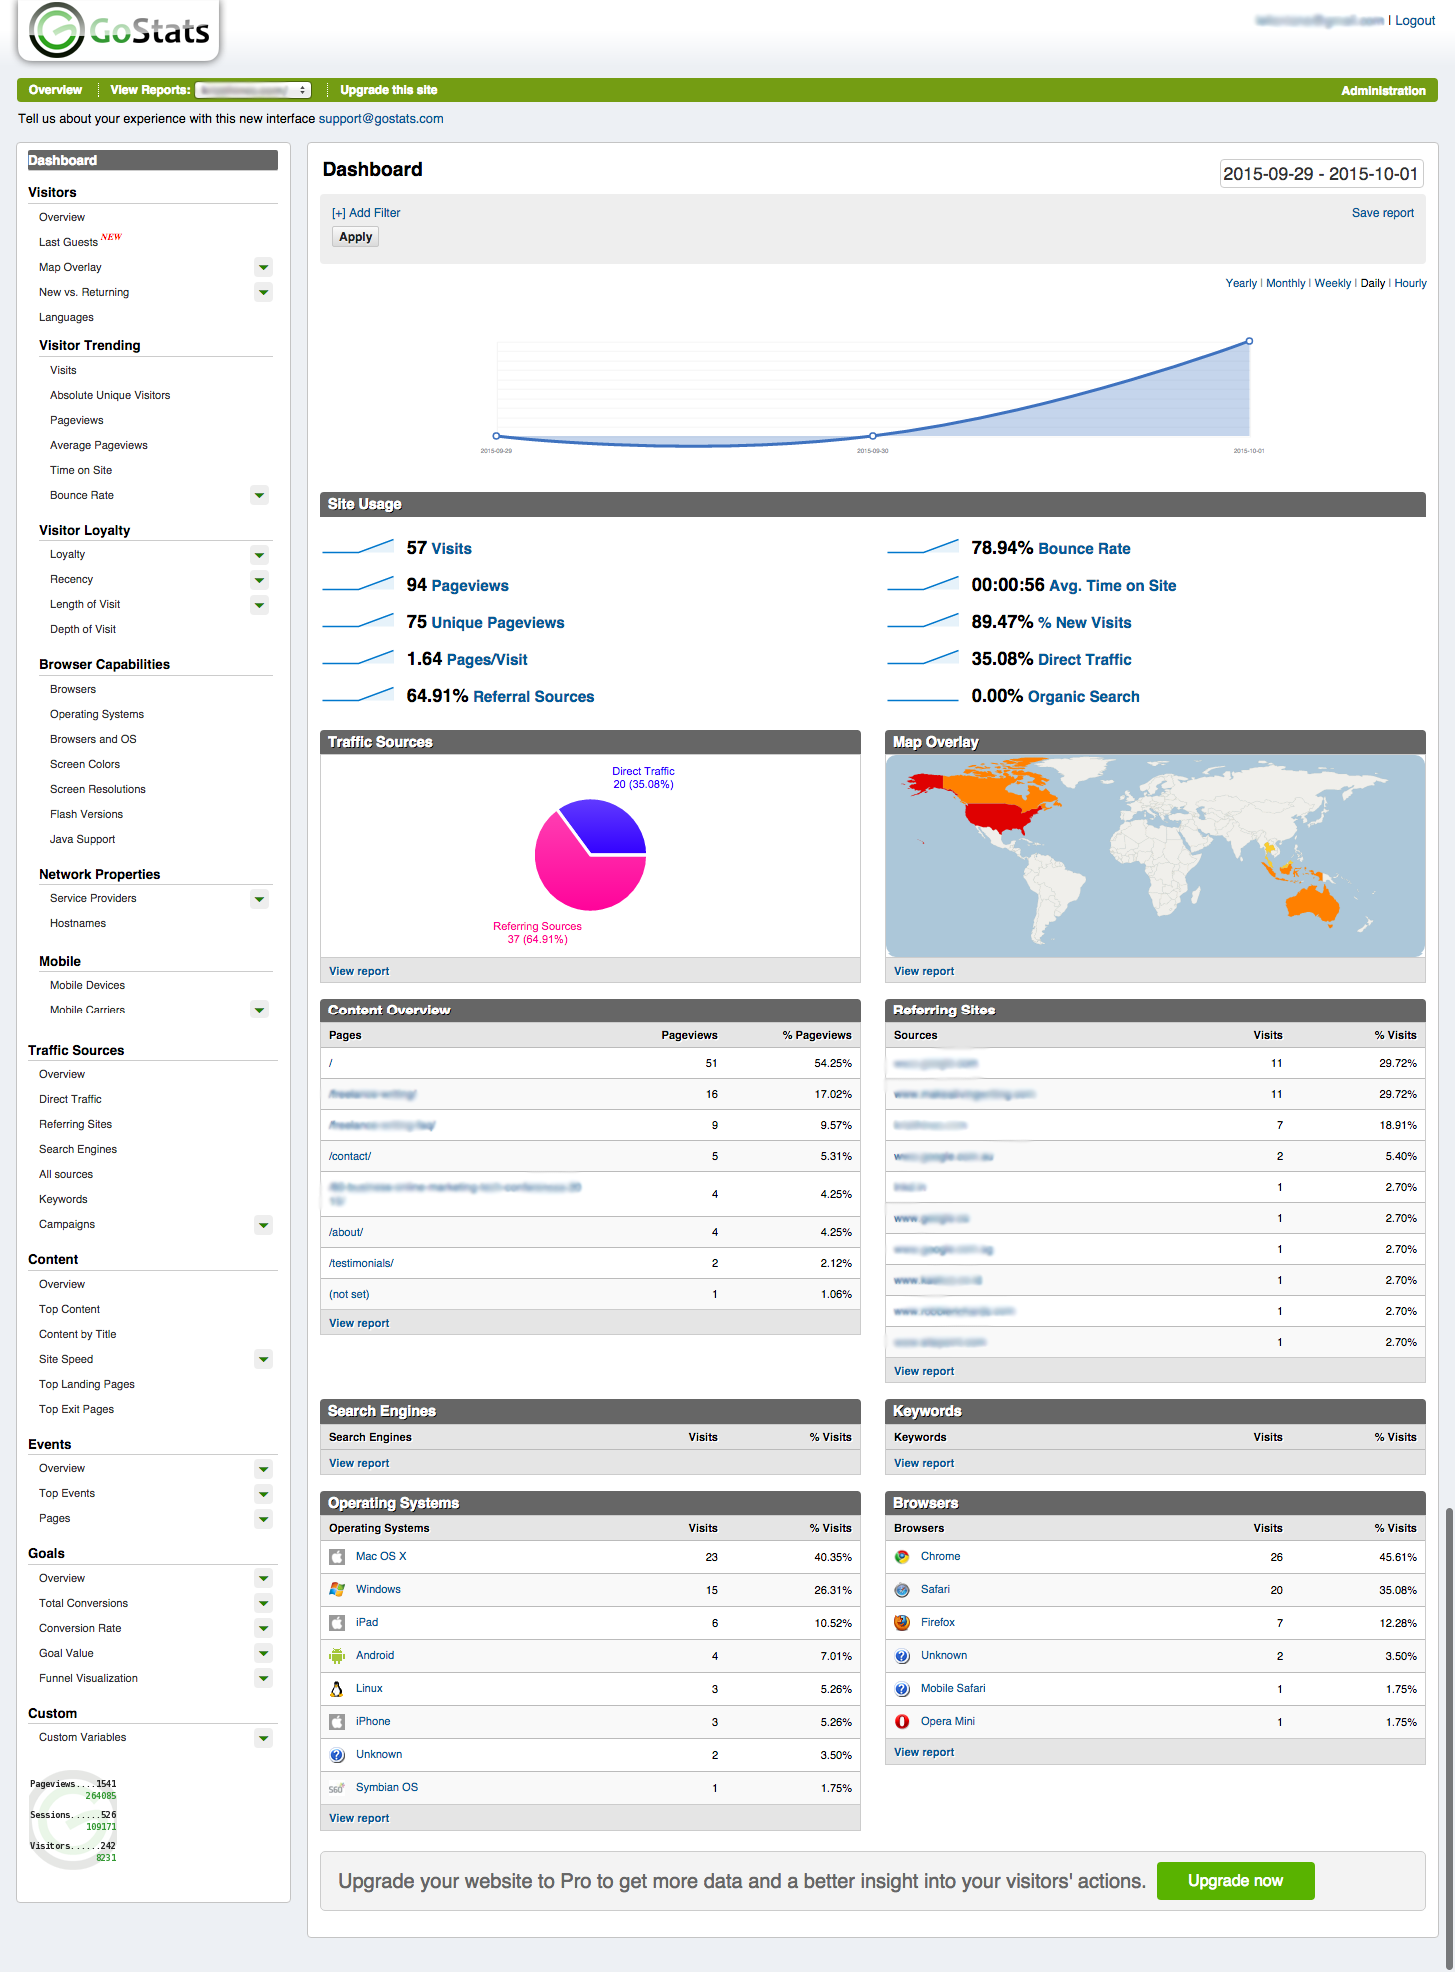
When
you open your website analytics, the first screen you will be greeted
by is your Visitors Overview. Here, you will find the key metrics you
need to determine your website's current traffic health.
Visits
The number of Visits you see is representative of the number of times
people have come to your website.
Think
of visits as a session on your website. Within one visit, a visitor may
view one or more pages on your website, a number which is totaled in
with the Pageviews metric. Your number of Pageviews will generally be
higher than your number of Visits if you have more than one page on
your website.
While the number of Visits you have over a long
time period are likely to ebb and flow based on the days your website
is most popular (for most websites, this will be weekdays), you can use
the overall timeline of your number of Visits to catch potential
problems on your website.
Here are some examples of how to use Visits to diagnose issues on your
website.
●
If you notice that your Visits dropped for one day and then returned to
normal, it could reflect a website hosting outage or other glitch on
your website.
● If you notice it has dropped for
several days and has not returned to normal, it could reflect a change
on your website that needs to be looked into, such as the removal of
your analytics code.
● If you notice it has
dropped for several days and has not returned to normal, it could also
mean that you have lost a particular source of traffic that needs to be
looked into, such as a specific website referrer, organic search
ranking, or advertising.
● If you notice that
your Visits increased for one day and then returned to normal, it could
mean that you received a mention that drove a lot of instant traffic.
As
a whole, the sign of a website with healthy traffic is one where the
Visits stay steady or increase over time. Any declines in Visits should
be researched thoroughly.
Unique Visitors
Another
metric you will find in your Visitors Overview is the number of Unique
Visitors who visit your website. Your website analytics will determine
if a visitor is unique based on a cookie stored in their browser after
their first visit. If there is no cookie, your website analytics will
count the visitor as a new Unique Visitor.
For example, if
someone visits your website from their desktop browser, and then they
visit your website from their mobile browser, they will be counted as
two Unique Visitors. Later, if they return to your website from either
browser, they will be counted as a new Visit, but not a new Unique
Visitor.
Unique Visitors are important when you are trying to
bring new visitors to your website. For example, if you are advertising
for new customers on Facebook, you will want to see your number of
Unique Visitors continue to increase as your ad campaign progresses.
Average Pageviews
If
you have more than one page on your website, chances are that you want
visitors to browse beyond the page they enter your website upon. The
number of Average Pageviews represents the average number of pages that
visitors browse upon your website during a visit.
For most
website owners, a higher number of pageviews during a visit ultimately
results in more engagement and goal completion. For example, if you run
a blog, the visitors who enter your website on a blog post and leave
will not be introduced to your products or services, and thus not
convert from a visitor into a customer or lead.
The visitors
who enter your website on a blog post and then continue to browse more
pages on your website are more likely to convert into a customer or
lead by being exposed to more of your website offerings. Thus, a higher
number of Average Pageviews means that your website is more successful
in getting visitors to browse more of your website.
To continue
increasing your number of Average Pageviews, you will need to give
visitors on every page of your website a reason to click through to
more pages. On blog posts, this may mean adding clear navigation to
your header, image banners to your products or services, and links to
additional reading throughout your content.
The only pages you
would want to exclude from this are your landing pages that focus on a
specific goal: making a sale, converting a lead, or opting in an email
subscriber. On landing pages, you do not want to encourage visitors to
go elsewhere until after they have completed the goal on the page.
Average Time on Site
No
matter how many pages you have on your website, something that could
always stand for improvement is your Average Time on Site. This metric
shows you how long visitors stay on your website on average, regardless
of the number of pages they view.
In general, if you notice
you have a 30 second or below average, it tells you that majority of
people who visit your website are not there long enough to complete a
specific goal, such as make a purchase, submit a lead form, or optin to
your email list.
Hence, your goal will be to figure out how to
keep visitors on your website longer. Some steps you can take for this
include clearer navigation to ensure people quickly can find what they
are looking for, adding video content, and adding more content.
2. Test the results of specific actions in real time with
Last Guests.

Want to know what is happening your website right now? Try the Last
Guests report. This will show you how many visitors you have on your
website right now, where they came from, and what they are doing on
your website.
If you are running any specific tests on your website, such as
launching a new page, or if you are running any specific campaigns,
such as a new ad on Facebook, the Last Guests report will show you the
immediate results. Respectively, it will show you whether people are
going to your new page or clicking on your ad.
In addition, you can see a log of the most recent visitors to your
website with basic details on where they are located, where they came
from, what they did on your website, and the technology they used.
3. Learn about your visitor's Browser Capabilities
to ensure your website functions properly.

Whenever you make a major change to your website, it's important to
review the reports under Browser Capabilities for a while to ensure
that everyone is able to access and use your website based on their
technology.
Chrome, Safari, and Firefox are going to be the most widely-used
browsers by most of your visitors. If you notice that the metrics for
these browsers vary dramatically, such as your Safari visitors having a
significantly shorter Average Time on Site than your Chrome visitors,
it may be a good idea to test your website in Safari to ensure it is
functioning correctly.
4. Find out if you need to be more mobile friendly with
Mobile Devices.

In addition to knowing if a visitor's browser affects their experience
on your website, regularly reviewing mobile device usage can also help
ensure that everyone has a great experience on your website. First,
knowing that you have a high number of iPhone and Android users can let
you know whether it's time to invest in a responsive or mobile-friendly
website design. Second, it can show you if mobile users are having
issues on your website, based on their Average Time on Site and Pages
per Visit.
5. Determine what marketing strategies are working best with
Traffic Sources.

There are three types of traffic that come to your website: Direct
Traffic, Referral Source, and Organic Search.
● Direct Traffic refers to any traffic
that does not have an trackable referral source, such as when people
type your URL into their browser's address bar or access it from a
local browser bookmark.
● Referral Source refers to any traffic
that comes from a trackable referral source other than a search engine.
This includes traffic from social networks and other web pages that
link to your website.
● Organic Search refers to any traffic
that comes from people using search engines like Google, Yahoo, Bing,
Search, and Yandex.
Referral Source and Organic Search reports will help you determine what
marketing strategies are driving the most visitors to your website. You
can use the Referral Source report to find out if you get more visitors
from Facebook versus Twitter, Yelp versus MerchantCircle, or one
advertising source versus another.
You can use the Organic Search reports to monitor your traffic from the
top search engines to determine if your keyword rankings are increasing
in visibility thanks to a strong SEO campaign or decreasing in
visibility thanks to the latest updates in search algorithms.
You can also use these reports to determine which referral sources and
search engines drive the most quality visitors to your website. For
example, if you see that one referral source drives a lot of visitors
to your website, but has an Average Time on Site of three seconds while
your overall Average Time on Site is fifty seconds, then it may
indicate that the referral source may not be as great of a traffic
source as you thought.
Overall, if you are running specific marketing campaigns to drive
visitors to your website, you will want to constantly monitor your
Referral Source and Organic Search reports to determine whether those
campaigns are successful. Using the data from these reports, you can
determine whether you should focus more energy into one strategy over
another based on the amount of visitors you receive and the quality of
those visits.
6. Find out what your visitors really want with your Top
Content.

The Top Content report for your website can help you determine a number
of things about your overall marketing strategy. For starters, it can
show you the most popular page on your website. For most websites, this
is going to be either a homepage, top product page, or top piece of
content on a blog.
Once you know what the top content is on your website, you can make
sure it is optimized for conversions. Here are just a few things you
can do based on the type of top content on your website.
● If you notice it is a blog post, you
may want to check the post page itself to make sure it is leading
visitors to check out your products or services, contact form, or email
list optin.
● If you notice it is a category page for
your products, you may want to update that page to show your most
popular products at the top so visitors can find them easier to make a
purchase.
● If you notice it is your homepage, you
may want to update that page to highlight one or more of your top
products or services.
When viewing the metrics for your top content, it's important to note
specific metrics such as Average Time on Site, Site Speed, and Bounce
Rate. These will help you determine which pages on your website keep
people on your website longer, have load timing issues, and encourage
people to continue browsing other pages on your website.
If you have a page in your top ten that is performing poorly compared
to others, it is crucial that you go into determine how to solve any
issues that could be affecting your user's experience, such as poor
content, slow loading due to a large image, or a lack of clear
navigation.
7. Get insight into what visitors are doing on your website
using Events.
If you need data beyond pageviews and bounce rates, you will want to
set up event tracking on your website. The Events reporting feature
allows you to track specific actions that your visitors take on your
website in your website analytics.
Examples of actions you can track include clicking on outgoing links,
playing embedded videos, or downloading a whitepaper. Tracking these
actions will allow you to determine if resources you are sharing are
valuable to your visitors, if your visitors like your latest video, and
if your visitors are downloading the in-depth content you share.
8. Track the results your website gets with Goals.
No matter what type of website you run, you likely have a conversion
that you want many of your visitors to complete. That conversion may be
to make a purchase, submit a lead form, subscribe to your email list,
comment on your blog posts, share your blog posts on social media, play
your videos, or something similar.
This is where goal tracking comes into play. When you set up goals
inside your website analytics, your website analytics can tell you when
visitors complete a specific goal based on whether they land on a
confirmation page, click a specific button, spend a certain time on
your website, or something else that you specify.
Once you have goals set up, you can use Goal reports to determine the
traffic sources, content, location of, and browsing habits of visitors
who make conversions on your website. This will help you further refine
your website marketing strategy.
Whenever you set up your website analytics, be sure to take some time
to think of the conversions you want to track on your website analytics
and include that in your basic analytics setup. This will allow you to
collect highly valuable data for years to come.
9. Identify your visitors using Custom Variables.
Want to go further with your website analytics? Then Custom Variables
are the answer. Custom Variables allow you to track your visitors in
new ways throughout your website. Here are just a few examples of how
you can use Custom Variables to get more out of your analytics data.
● If your website's main goal is content
publishing, you can use Custom Variables to track the performance of
content by specific authors, content categories, and content tags. You
can also track the behavior of your readers based on actions they take
such as commenting and sharing your posts on social media.
● If your website's main goal is
ecommerce sales, you can use Custom Variables to track visitors who
view an item, view a category of items, add items to their shopping
cart, and make a purchase.
● If your website's main goal is to
capture leads, you can use Custom Variables to track visitors who
submit your lead form versus those that just subscribe to your email
newsletter.
● If your website's main goal is to get
new registered members for a forum, application, or other service, you
can use Custom Variables to track logged in users versus those not
signed in to their account.
These are only a few examples of the many ways you can use Custom
Variables. As you are browsing your standard web analytics reports,
think of the different ways you would like visualize your data based on
the types of visitors that come to your website and the things they do.
Then create Custom Variables to make it happen.
In Conclusion
As you can see, there are many ways you can use website analytics to
troubleshoot potential problems, determine your overall website
marketing success, and help you decide on the right tactics to use to
drive traffic.